Stack traces in GHCJS
June 20, 2014 - Tagged as: haskell, ghcjs, ghc, gsoc, en.
I’m about to finish the first part of my GSoC project and as a part of my project I have implemented stack traces for GHCJS. Currently GHC.Stack functions should work in GHCJS, except for some cases I explain below.
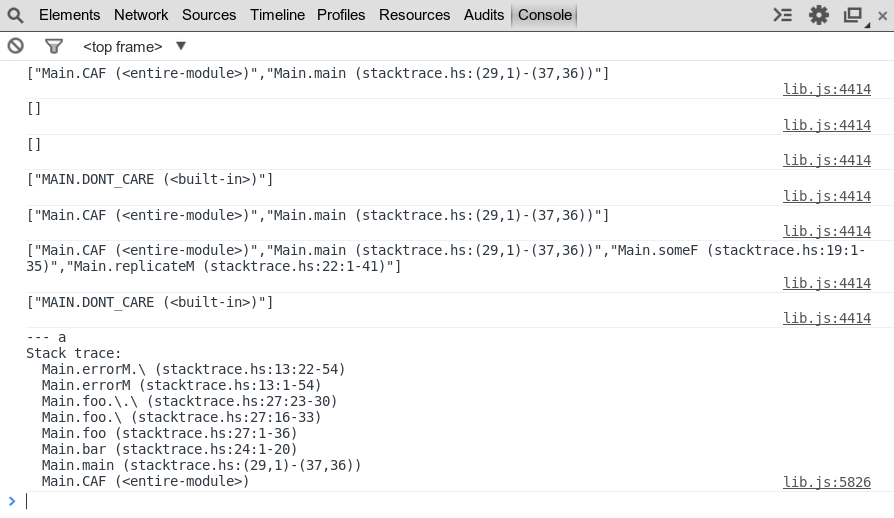
As a demo, I set up this page, it runs the Haskell program rendered on the page (some part of the code is copied from Simon Marlow’s “Why can’t I get stack traces?” presentation). Output is printed to the console. You should be seeing something like this:
My main goal is to implement profiling features of GHC (cost-centres, SCC annotations, reporting allocations/ticks etc.) for GHCJS. It turns out that cost-centre stacks and call stacks are same thing. GHC.Stack.currentCallStack returns the current cost-centre stack, and cost attribution is done to current call-stack(or current cost-centre stack, since they’re exactly the same thing). Similarly, GHC.Stack.whoCreated returns the cost centre stack that was active when the heap object was created.
20 changed files with 810 additions and 527 deletions later, I had GHC.Stack working. You won’t need to do anything different once it’s merged into GHCJS, but for now it requires some effort to install. It also still has some bugs and differences from GHC version. Rest of the post explains how to test it, bugs, and differences from GHC.
How to use
Because of a horrible bug(see bugs section), you need a 32bit system to use profiling features of GHCJS. You should clone my fork of GHCJS and shims. For GHCJS, switch to work3 branch(that 3 represents how many times I started from scratch :) and for shims switch to work2 branch. You need to install modified Cabal for GHCJS. After installing Cabal, install GHCJS and run ghcjs-boot --init -q --prof. This takes about 20 minutes on my system and compiles base and some other libraries. --prof is used to generate profiled versions of libraries.
After GHCJS has been booted, replace ~/.ghcjs/<your platform>/shims folder with my fork of shims(make sure you switched to work2 branch). Now you should be able to compile and run programs with profiling options of GHC. For example, to compile and run the example program given above, run ghcjs stacktrace.hs -prof -fprof-auto and then run generated stacktrace.jsexe/all.js using nodejs. Enabling profiling gives you a debug executable, with more metadata (object names) and longer (non-renamed) variable names.
Differences
Because GHCJS represents some objects as unboxed numbers and currently we don’t associate any cost-centres with this type of objects, whoCreated returns an empty list. If there’s demand, we can disable unboxing with a command line switch and whoCreated on these values would work. In the example program, second and third lines are printing empty lists because of this.
Bugs
Currently we discovered two bugs:
There’s a horrible bug happening outside of GHCJS code, see my blog post and ghc-devs mail. Because of this bug, booting GHCJS with profiling enabled is resulting with a segfault on 64bit systems. I’m developing this project on a 32bit VM, running on a VPS :) I need to make some more progress before tracking this bug.
We’re having a bug that makes stack traces sometimes a bit different than the ones generated by GHC compiled programs. For example, the example program should have printed this stack trace:
Main.errorM.\ (stacktrace.hs:13:22-54)
Main.errorM (stacktrace.hs:13:1-54)
Main.foo.\.\ (stacktrace.hs:27:23-30)
Main.foo.\ (stacktrace.hs:27:16-33)
Main.foo (stacktrace.hs:27:1-36)
Main.bar (stacktrace.hs:24:1-20)
Main.runM.(...) (stacktrace.hs:16:20-31)
Main.runM (stacktrace.hs:16:1-36)
Main.main (stacktrace.hs:(29,1)-(38,36))
Main.CAF (<entire-module>)
.. but
runMcalls are missing in GHCJS output. I have no idea what could be the reason for this and I’m currently working to fix this. After fixing this, I think we’ll have exactly same stack traces as the ones produced by GHC compiled programs.
Acknowledgement
I’d like to thank my mentor Luite Stegeman for answering my endless questions, helping me understanding GHC and GHCJS internals and reviewing this blog post.